ECG interpretation is a core skill for medical students, but it does not have to be overwhelming. This guide covers the three fundamental steps: calculating the rate, determining the rhythm, and finding the cardiac axis. By mastering these basics, you will be able to read any 12-lead ECG with confidence and accuracy.
Why Rate, Rhythm, and Axis Matter
Every ECG tells a story about the heart’s electrical activity. The rate tells you how fast the heart is beating. The rhythm tells you if the beat is regular or chaotic. The axis tells you the direction of electrical flow through the ventricles.
Together, these three elements help you diagnose common conditions like sinus tachycardia, atrial fibrillation, and bundle branch blocks. They also guide clinical decisions, such as when to treat a slow heart rate or when to suspect a pulmonary embolism.
As a medical student, you will encounter ECG interpretation in exams, on the wards, and in simulations. Learning a systematic approach now will save you time and reduce errors later.
Step 1: Calculating the Heart Rate
Heart rate is the number of QRS complexes per minute. You can calculate it using several methods, depending on the rhythm regularity.
For Regular Rhythms: The 300 Method
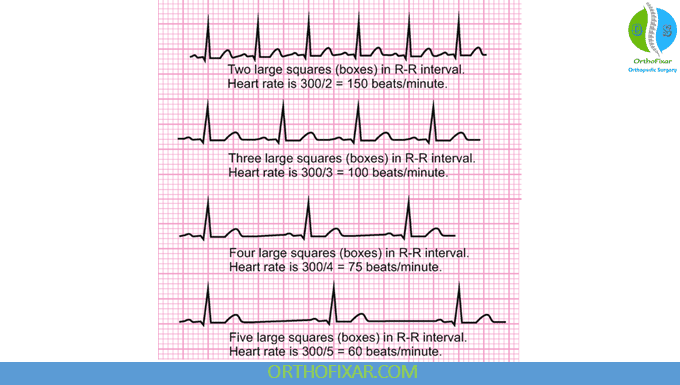
When the rhythm is regular, use the 300 rule. Count the number of large squares between two consecutive QRS complexes. Divide 300 by that number.
- 1 large square = 300 bpm
- 2 large squares = 150 bpm
- 3 large squares = 100 bpm
- 4 large squares = 75 bpm
- 5 large squares = 60 bpm
- 6 large squares = 50 bpm
For example, if there are 4 large squares between R waves, the rate is 75 beats per minute. This method works best at standard paper speed of 25 mm/s.
For Irregular Rhythms: The 6-Second Method
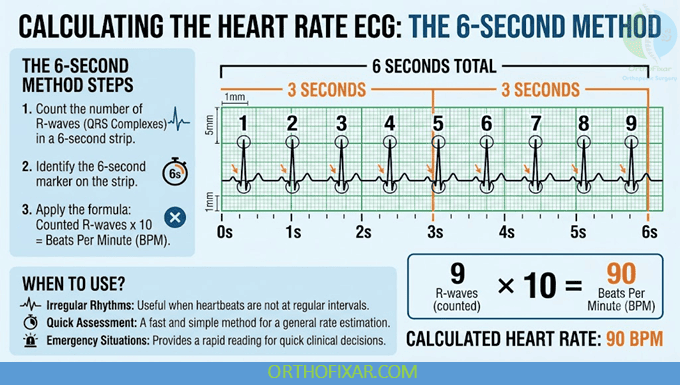
Atrial fibrillation and other irregular rhythms require a different approach. Count the number of QRS complexes in a 6-second strip (30 large squares). Multiply that number by 10.
If you count 12 QRS complexes in 6 seconds, the heart rate is 120 bpm. This method gives a reliable average rate even when the rhythm is chaotic.
Quick Reference Table for Heart Rate Calculation
| Method | Best For | Formula |
|---|---|---|
| 300 method | Regular rhythm | 300 ÷ large squares between R waves |
| 6-second method | Irregular rhythm | QRS count × 10 |
| 1500 method | Fast regular rhythm | 1500 ÷ small squares between R waves |
Step 2: Determining the Rhythm
Rhythm analysis answers two questions: Is the rhythm regular or irregular? Is the impulse originating from the sinus node?
Assessing Regularity
Use calipers or a paper edge to measure the R-R intervals. If they vary by less than one small square, the rhythm is regular. If they vary widely, it is irregular.
- Regular rhythm: sinus rhythm, atrial flutter, ventricular tachycardia.
- Irregularly irregular rhythm: atrial fibrillation.
- Regularly irregular rhythm: sinus arrhythmia, premature beats with fixed coupling.
A common exam scenario is a 70-year-old patient with an irregularly irregular pulse. The ECG shows no P waves and an erratic baseline. This is atrial fibrillation.
Checking for P Waves
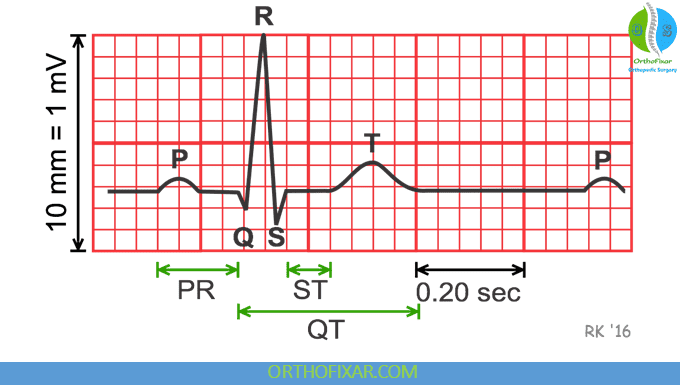
P waves represent atrial depolarization. In sinus rhythm, each P wave is upright in lead II and precedes each QRS complex. Look at the relationship between P waves and QRS complexes.
“A normal P wave in lead II is the hallmark of sinus rhythm. If you cannot find it, suspect an ectopic atrial focus or atrial fibrillation.” — Standard ECG teaching
If P waves are absent or have different shapes, consider conditions like junctional rhythm or atrial tachycardia. If P waves occur after the QRS complex, think of retrograde conduction.
Common Rhythm Patterns
- Sinus rhythm: rate 60-100, regular, upright P waves in lead II.
- Sinus bradycardia: rate less than 60, otherwise normal.
- Sinus tachycardia: rate greater than 100, otherwise normal.
- Atrial fibrillation: no P waves, irregularly irregular rhythm.
- Atrial flutter: sawtooth flutter waves, usually regular.
- Ventricular tachycardia: wide QRS, fast rate, no P waves.
Step 3: Determining the Cardiac Axis
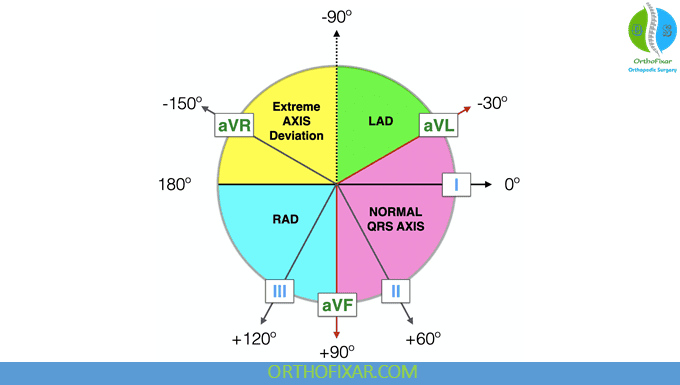
The cardiac axis describes the overall direction of ventricular depolarization in the frontal plane. Normally, the axis points between -30 degrees and +90 degrees.
The Quadrant Method
Check leads I and aVF. This gives you a quick quadrant location.
- Lead I positive, aVF positive: normal axis (0 to +90 degrees).
- Lead I positive, aVF negative: left axis deviation (0 to -90 degrees).
- Lead I negative, aVF positive: right axis deviation (+90 to +180 degrees).
- Lead I negative, aVF negative: extreme axis deviation (-90 to -180 degrees).
For example, a patient with left axis deviation has positive QRS in lead I and negative QRS in aVF. This is common in left anterior fascicular block.
Finding the Isoelectric Lead
For a more precise axis, find the limb lead with the most isoelectric (flat) QRS complex. The axis is perpendicular to that lead. Then check which adjacent lead is positive.
If lead aVL is isoelectric and lead I is positive, the axis is approximately 0 degrees. This level of detail helps distinguish between left anterior fascicular block and inferior myocardial infarction.
“The axis is often overlooked, but it holds clues to ventricular hypertrophy, conduction defects, and prior heart attacks.”
Clinical Correlations of Axis Deviations
- Left axis deviation: left anterior fascicular block, inferior MI, left ventricular hypertrophy.
- Right axis deviation: right ventricular hypertrophy, pulmonary embolism, lateral MI.
- Extreme axis deviation: ventricular tachycardia, hyperkalemia, congenital heart disease.
Putting It All Together: A Practical Example
You are handed a 12-lead ECG of a 55-year-old man with chest pain. First, calculate the rate. The rhythm is regular, and there are 4 large squares between R waves, so the rate is 75 bpm.
Next, analyze the rhythm. P waves are upright in lead II and precede every QRS complex. The R-R intervals are equal. This is normal sinus rhythm.
Finally, check the axis. Lead I is positive, and lead aVF is positive. The axis is normal. You can now report: sinus rhythm at 75 bpm with a normal axis. This serves as a clean baseline for further evaluation of ST segments and T waves.
Common Pitfalls for Medical Students
Many beginners confuse left and right axis deviation. Remember: left axis deviation points toward the left shoulder (lead I positive, aVF negative). Right axis deviation points toward the right foot (lead I negative, aVF positive).
Another mistake is forgetting to check the paper speed. If the ECG was recorded at 50 mm/s instead of 25 mm/s, the rate calculation will be off by half. Always confirm the speed before measuring.
Finally, do not skip the rhythm step. A seemingly straightforward tracing can hide subtle P wave changes or premature beats that change the management plan.
How to Improve Your ECG Interpretation Speed
Practice the same sequence every time: rate, rhythm, axis, then intervals, then morphology. This habit prevents missing key findings.
- Use online ECG simulators to practice on real tracings.
- Work through 10 ECGs per week during your cardiology rotation.
- Discuss challenging cases with peers or attending physicians.
With consistent practice, ECG interpretation becomes automatic. You will recognize atrial fibrillation within seconds and calculate axis deviations without calipers.
Conclusion
ECG interpretation for medical students starts with mastering rate, rhythm, and axis. These three pillars give you a complete picture of the heart’s electrical function. The rate tells you about hemodynamic stability. The rhythm identifies arrhythmias. The axis reveals structural and conduction abnormalities. By using the 300 method, checking P waves, and applying the quadrant method, you can confidently interpret any ECG you encounter. Keep practicing, and soon this systematic approach will feel like second nature.
Frequently Asked Questions
What is the fastest way to calculate heart rate on an ECG?
The fastest method for regular rhythms is the 300 method. Count the number of large squares between two R waves and divide 300 by that number. For irregular rhythms, use the 6-second method by counting QRS complexes in a 6-second strip and multiplying by 10.
How do I know if a rhythm is sinus rhythm?
Sinus rhythm requires three criteria: a heart rate between 60 and 100, a regular R-R interval, and upright P waves in lead II before every QRS complex. If any of these are missing, the rhythm is not sinus.
What does left axis deviation mean clinically?
Left axis deviation means the electrical impulse travels more leftward than normal. Common causes include left anterior fascicular block, inferior myocardial infarction, and left ventricular hypertrophy. It is also seen in some normal variants, especially in older adults.
Can I determine axis without measuring degrees?
Yes. The quadrant method using leads I and aVF is sufficient for most clinical settings. A positive QRS in both leads indicates normal axis. A negative QRS in aVF with positive in lead I indicates left axis deviation.
Why is the ECG paper speed important?
Standard paper speed is 25 mm/s. If the speed is 50 mm/s, each large square represents half the usual time. Using the 300 method at 50 mm/s would give a falsely low heart rate. Always verify the speed before calculating.
What is the difference between regular and irregularly irregular rhythm?
Regular rhythm has equal R-R intervals. Irregularly irregular rhythm has no pattern to the R-R intervals, as seen in atrial fibrillation. Regularly irregular rhythm has a repeating pattern of irregularity, such as sinus arrhythmia or fixed coupling from premature beats.
How does axis help diagnose pulmonary embolism?
Acute pulmonary embolism often causes right axis deviation due to acute right ventricular strain. This finding, combined with sinus tachycardia and S1Q3T3 pattern, raises suspicion for pulmonary embolism. However, axis alone is not diagnostic.
What does a negative QRS in all limb leads mean?
A negative QRS in all limb leads suggests extreme axis deviation, also called northwest axis. This is often seen in ventricular tachycardia, hyperkalemia, or congenital heart disease. It requires immediate clinical correlation.
Can axis change over time in the same patient?
Yes. Axis can shift with acute conditions like myocardial infarction, pulmonary embolism, or electrolyte disturbances. Chronic conditions like left ventricular hypertrophy cause gradual axis changes. Comparing current ECG to previous ones helps identify new problems.
What is the easiest way to remember the 300 method?
Memorize the sequence: 1 square = 300, 2 squares = 150, 3 squares = 100, 4 squares = 75, 5 squares = 60, 6 squares = 50. Practice with 10 random ECGs until the numbers become automatic.